
The Power of Data Visualization
Artikel konnten nicht hinzugefügt werden
Der Titel konnte nicht zum Warenkorb hinzugefügt werden.
Der Titel konnte nicht zum Merkzettel hinzugefügt werden.
„Von Wunschzettel entfernen“ fehlgeschlagen.
„Podcast folgen“ fehlgeschlagen
„Podcast nicht mehr folgen“ fehlgeschlagen

The Power of Data Visualization
-
Gesprochen von:
-
Von:
Über diesen Titel
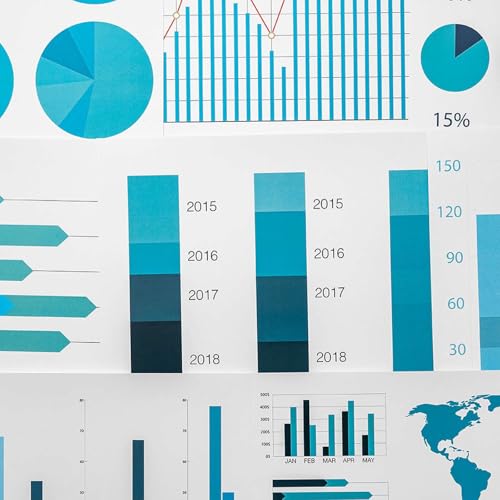
This conversation explains data visualization, defining it as the graphical representation of information through various charts, diagrams, and maps to simplify complex datasets. It emphasizes the importance of data visualization for informed decision-making, data interpretation, and visual communication across diverse fields like marketing, healthcare, and finance. The conversation also explores different types and functions of data visualizations, such as showing data over time or making comparisons. Furthermore, it highlights the benefits of using visual communication for efficiency while cautioning about potential pitfalls like misrepresentation due to poor data quality or incorrect chart choices. Finally, it offers guidance on selecting the appropriate visualization based on data type, audience, and purpose, along with best practices for creating accurate, accessible, and impactful visuals.
Support the show
